Start Asking Your Data 'Why?' - A Gentle Intro To Causal Inference (Part 1/4)

This is the first of a four part series aimed at decision makers, technical or managerial, who would like to improve their skills by adding causal intuition to their tool box.
Here we describe the importance of causal thinking and what to expect from this series.
Why Ask “Why?”
Causal inference techniques may result in more meaningful results than the common associative interpretation of data.
Decision makers put a lot of trust in data. This confidence manifests in claims like “data does not lie”, “data is king”, “data is the new oil”, or best quipped by the statistician William E. Denim:
We are all beneficiaries of data driven decisions. We live healthier lives than our ancestors thanks to medical conclusions from biological research that suggest what we should and should not put into our bodies.
We also have access to all of human knowledge via pocket sized devices thanks to smart algorithms for effective communication of data. One common benefit is daily optimisation suggestions from applications. Navigation software, e.g, suggests the best routes from point A to B based on various assumptions made by the engineers on what is considered “optimal”.
However, when it comes to decision making, human or automated, a critical question is often overlooked - is data, in itself, really enough for making reasonable decisions on which to act?
After all, a research lead might draw inconclusive or, even worse, incorrect conclusions from data. For example, even though we now know that smoking adds risk to developing lung cancer, in the 1950’s and 1960’s this was hotly debated, where many times data analyses were deemed inconclusive (see: 1, 2). Another example is the famous 2013 study on the benefits of the Mediterranean diet against heart disease that had to be retracted in 2018 by the most prestigious of medical journals, because not all participants were randomly recruited (see: 3, 4).

As for automated decision making, many modern algorithms, such as neural networks, excel at identifying patterns, but not context. It has recently been quipped that the most sophisticated computer algorithms are not smarter than a seven month old. That’s why machine learning is not regarded as understanding.1
As a consequence, small changes to an algorithm’s settings may result in meaningless to deleterious outcomes. This manifests in toy examples as deep learning modules that outperform humans in video games but requires hours to days of recalibration when, e.g, the input is slightly modified, in a manner which makes no significant difference for a human. Imagine, e.g, a game of Tetris or Breakout being modified by adding or subtracting one row of pixels.
A more concerning example is dangerous situations that may arise from vulnerabilities of image recognition algorithms in self-driving cars. Something as simple as adding a post-it on a stop sign may cause confusion in a neural network which would result in it to confidently classify the sign as a yield, something that would never fool a human. Not only can mishaps be dangerous but even more worrisome vulnerabilities may be maliciously exploited.

to confidently declare it as a speed limit sign.
(Credit: WIRED)
Research inconclusiveness and machine learning hiccups make it not uncommon to hear scientists and machine learning practitioners apologetically claim that
But, as it turns out, we can do better. With some simple ingenious tricks that have been developed in the past 30 years, one can unveil causal relationships with readily available data, without having to resort to expensive randomised control trials.2
In this series of posts you will learn how to add causal reasoning to your tool box.
In the second post you will learn about the importance of describing the story behind the data which will enable you to draw more meaningful conclusions.
This will be followed up by a post introducing Graph Models as a simple to understand yet powerful visual aid to portray the story behind the data. This will enable practitioners to both better interpret their experiments as well as design them.
In the fourth and final post we will discuss a classic case of data misinterpretation called Simpson’s paradox, where you will learn how to identify and resolve it by controlling for confounding factors.
For the more technical minded we will also provide pointers at how to climb the Causality ladder, as illustrated in Figure 3.
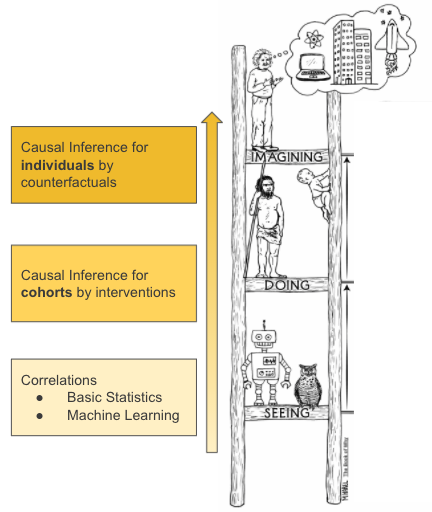
different level of complexity of causal inference.
(Credit: The Book of Why)
We illustrate how the lowest rung symbolises the associative/correlation methods of analysis that are commonly used in predictive modeling including advanced machine learning. We describe how by understanding the story behind the data one advances to the next rung - causal inference of cohorts. The highest rung is where the most powerful causal inference lies - on individual cases. To illustrate this last point, imagine that instead of quantifying the benefit of taking medicine for the average female in the age range of 35-40, to be able to predict for your own family member.
Finally we emphasise that whereas causal inference is not always possible, it should be an inspiration of a goal to aim for in any analysis and data driven decision making.
In the next post you will learn about the importance of understanding the story behind the data to draw causal conclusions.
The Story Behind This Series
As a data scientist, in late 2020 I decided to add causal inference to my statistical toolbox to improve how I facilitate stakeholders to make data driven decisions.
For this purpose I formed in my company a study group in which we covered Pearl’s Primer textbook within six sessions. This resulted in both improved interpretation of analyses as well as experiment design.
I found myself advocating for the learnings from the study group in numerous circles so much so I figured, as the saying goes:
Hence this series.
To that I’d like to add
Which I did. In 2021 I was fortunate to have the opportunity to present both internally at work, as well as two outreach talks globally (virtually).
The content of this series and further information and resources are provided in my presentation: Start Asking Your Data ‘Why?’ - A Gentle Introduction to Causal Inference
- Slide Deck:
bit.ly/start-ask-why - EuroPython recording:
bit.ly/start-ask-why-europython. - PyData Global recording


Alternatively you can watch the EuroPython presentation here. No background in python or statistics is required.
-
Ironically my spelling corrector is doing an amazing job at pointing out grammar mistakes and making excellent suggestions, but does not comment on the fact that I am somewhat deriding it by pointing out the limitations of it and its non sentient siblings and cousins … ↩
-
Randomised Control Trials are considered the golden standard for causal analysis in many experimental settings by controlling for confounding factors. Their main setback, however, is that these tend to be either very expensive, or not feasible, or both. In causal inference we are interested in finding causal relationships in more readily available and cheaper data sets, often referred to as “observational data”. ↩