Look at the Data!
I wrote this following post below when in my last few months working in a small consulting agency that focused on narrowcasting marketing. It’s kind of a light (sort of advertising) piece article geared to business minded people about the importance of exploring data as a very crucial step for making decesions.
As an example I describe a commercial project that I worked on in which I took a deep look into a client’s data before creating predictive models on which I designed a successful A/B test.
The reason I post it here is because I am actually proud about the said case study and placing it here for my own personal documentation. It was the first (and I think only) experience that I had in my 3.5 years there in which I actually got results back from the field and I could quanitied the impact of my predictive modeling. (As opposed to a binary repsonse from clients: Like/Don’t Like).
Perhaps one useful take away for (junior) Data Scientists is the importance of understanding the full context of data as much as possible before making crucial decisions in analysis (or shoving down a Machine Learning pipeline).
The company site, doesn’t exist anymore, so I copied it from the web archive time machine, specifically here.
17 Oct 2017, by Dr. Eyal Kazin, Senior Data Scientist at CA, London, UK BLOG
Most decisions are made with some element of uncertainty, and can be, to a certain degree, leaps of faith. At Cambridge Analytica we believe that the best choices are made when data is used to inform decision making and reveal a clearer path.
Every growing business is confronted with challenging questions. How do we break into a new market? What should we do to improve our brand or introduce a new product?
In most cases the answer boils down to four words: Look at the data!
Here we’ll address the two main aspects of this mantra – what we mean by Look, and what constitutes Data – before concluding with an example.
Data
When trying to answer a tough question there are normally two data types of interest:
- Relevant data that the company has access to (internally or externally: e.g. in-house, vendors, open source)
- Relevant data that the company does not have access to (e.g. that belonging to potential collaborators/competitors, data vendors)
(Yes, you are reading between the lines correctly, not all data is relevant.)
At Cambridge Analytica we specialise in exploring data sets to identify what is available, what could/should be obtained to add value, and how the data can be used.
Look
Having data is an excellent start. Understanding it, however, is crucial.
The looking part has two essential phases: understanding the data, and asking the data. These could be addressed in an agile manner, but in the first instance it is vital to understand what data is available and also its context.
For example, how was the data collected? Is the sample truly representative of the target market, or is it skewed towards a specific segment? An unfiltered online survey might over-sample stay-at-home middle-aged females, which might not be useful for an intended target audience, e.g. teenagers. Even though this might sound trivial, most cases are subtle and require attention to these details to reduce bias.
Once the data is understood (or at least a reasonable portion is) one needs to clarify what is being asked from it. When phrasing a question one should remember that an answer is only as good as:
- The question being asked – if the question is well defined, the answer is more likely to be so, too.
- The data used – this is what we discussed above: know your data! Is the data relevant for the question being asked? Should more sources be acquired?
- The assumptions made – a wrong assumption might lead to a biased answer.
Case Study
To better explain, let’s run through an example. We recently worked with a midsize American restaurant chain to help drive customers to their stores.
They asked us how to bring new customers through the door, so we responded with our mantra: ``Let’s look at the data.”
The first question we asked the data was ``How far away are people coming from?”. We looked into this because their product is geo-sensitive (i.e. customers have to visit the restaurants), meaning that the longer people have to drive, the less likely they are to be a customer. Think in terms of how far you are willing to go for a haircut or to go to the gym.
We could investigate this question because they have records of customer addresses, from which we calculated distances to the restaurant locations. (In densely populated areas, ZIP codes might work fine, too.)
Prior to our involvement, the client ran promotions targeting households within two miles from their stores. Their sales data, however, clearly showed that people were willing to travel further. We suggested a promotion extending out to six miles from the locations, three times further than before, arguing that they can find new low-hanging fruit. We launched a promotion to test this hypothesis and found this to be true.
We demonstrate this in the following figure, which shows as a function of distance:
- New customer promotion redemption rates (red; 95% confidence level bands indicate significance)
- Ratio of number of known customers (pre promotion) to the general public (light blue)
The bins are range centered (e.g. the bin at 1.5 is all values between one and two miles).
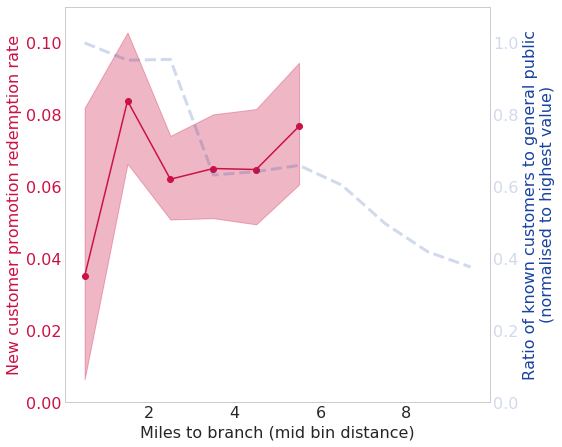
The figure shows that, although the redemption rate drops from one mile, it is fairly flat from two to six (red). A similar plateau between three to six miles is shown in the distribution of their known customers (light blue).
The takeaway from this experiment was that the client gained confidence in attracting new customers who reside at larger distances. We learned this from the addresses collected in the sales data. Thanks to this data we could be more adventurous and push the promotion out three times further than before.
To summarise, business improvement requires knowledge answered through tough questions, and normally there are many options to consider. An understanding of what data is relevant, its context, and asking it clear questions is likely to point to the optimal choice. To make things even more interesting, data might suggest a direction that you haven’t even thought of.
So, go ahead, take a look!